Research dataset
Vacation Home Statistics by State and County: Latest U.S. Census Data
The United States has 4,342,127 homes held for seasonal, recreational, or occasional use — 3.0% of all 146,740,964 housing units — per the 2024 American Community Survey 1-year estimates. This page ranks every state and every one of the 3,144 U.S. counties and county equivalents by vacation-home count and share, from verified Census source files. Every table, figure, and the complete dataset can be downloaded and reproduced below.
Data verified July 29, 2026 · Page last updated July 30, 2026 · Vintages: 2024 ACS 1-year, 2020-2024 ACS 5-year, 2015-2019 ACS 5-year comparison
Key findings
4,342,127
U.S. homes for seasonal, recreational, or occasional use, 2024 ACS 1-year estimates.
802,265
Florida — the most vacation homes of any state, 2020-2024 ACS.
-12.8%
Change in U.S. seasonal-use homes from the 2015-2019 to the 2020-2024 ACS period.
National totals
Two official products measure the national stock. The 1-year product is the most current annual reading; the 5-year product is the one that extends to every county. They are shown separately and never mixed.
| Measure | 2024 ACS 1-year | 2020-2024 ACS 5-year | 2015-2019 ACS 5-year |
|---|---|---|---|
| Seasonal, recreational, or occasional-use homes | 4,342,127 | 4,743,227 | 5,440,455 |
| Share of all housing units | 2.96% | 3.30% | 3.96% |
| Share of vacant housing units | 31.0% | 32.6% | — |
| Total housing units | 146,740,964 | 143,775,355 | — |
| Count margin of error (90%) | ±49,611 | ±43,757 | — |
All 50 states and D.C., ranked by vacation-home share
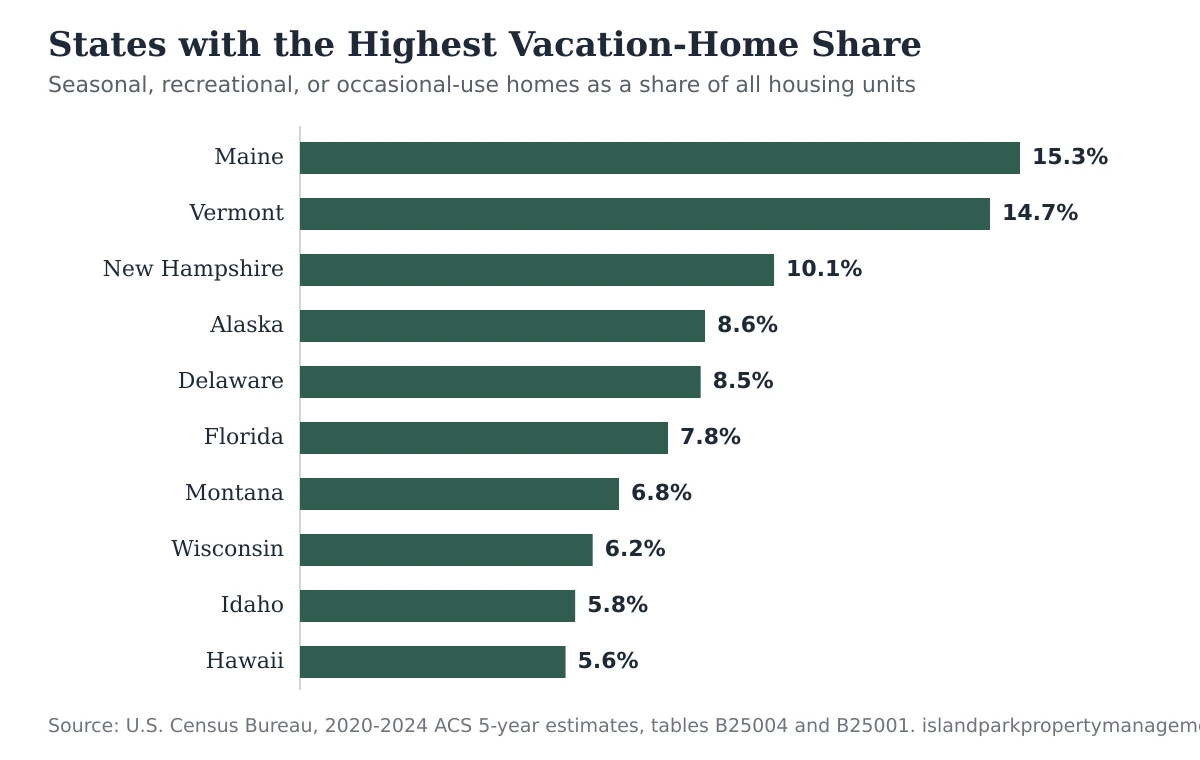
Share of all housing units is the cleanest way to compare states of different sizes. Maine leads at 15.3%; the full 51-row ranking follows, with the raw-count rank shown alongside.
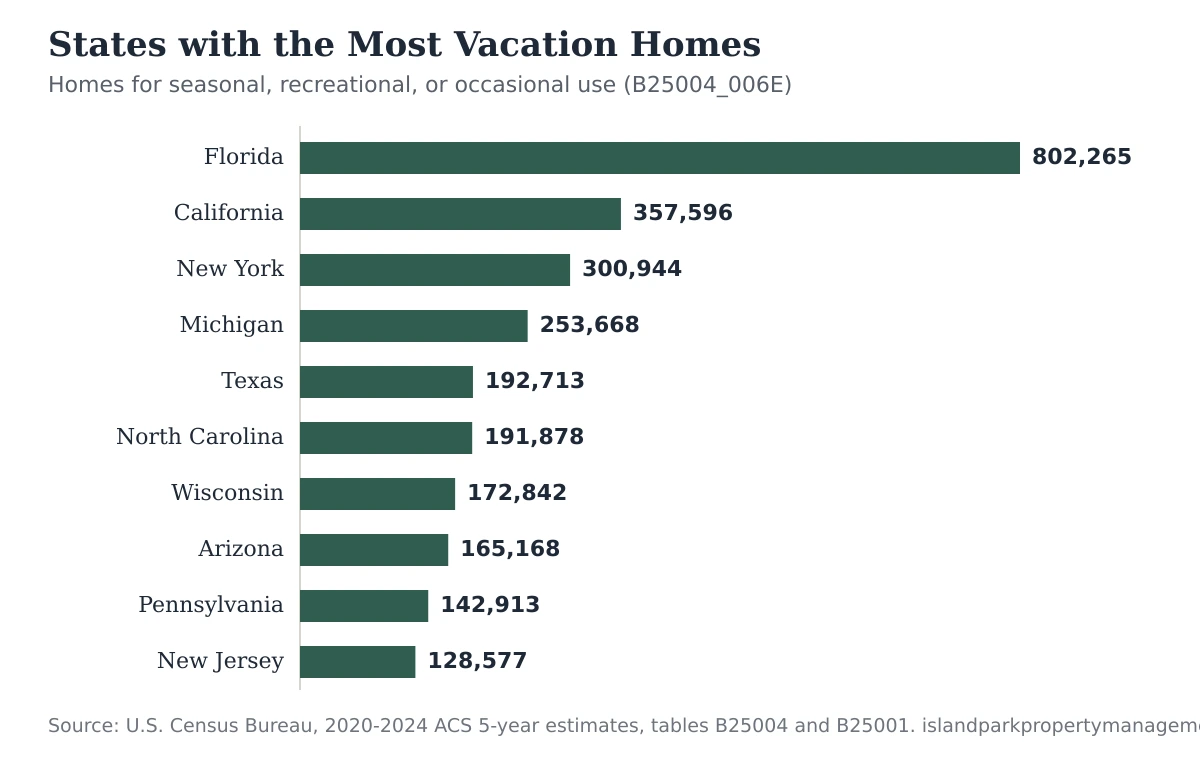
States with the most vacation homes
| State | Count rank | Seasonal-use homes | MOE (90%) | Share of all housing | Share rank |
|---|---|---|---|---|---|
| Florida | 1 | 802,265 | ±10,646 | 7.8% | 6 |
| California | 2 | 357,596 | ±6,059 | 2.4% | 34 |
| New York | 3 | 300,944 | ±4,772 | 3.5% | 22 |
| Michigan | 4 | 253,668 | ±3,162 | 5.5% | 11 |
| Texas | 5 | 192,713 | ±3,164 | 1.6% | 46 |
| North Carolina | 6 | 191,878 | ±3,713 | 3.9% | 16 |
| Wisconsin | 7 | 172,842 | ±2,069 | 6.2% | 8 |
| Arizona | 8 | 165,168 | ±3,478 | 5.2% | 12 |
| Pennsylvania | 9 | 142,913 | ±2,623 | 2.5% | 33 |
| New Jersey | 10 | 128,577 | ±1,979 | 3.4% | 24 |
2024 annual supplement: nation and states only
The 2024 ACS 1-year product is the most recent annual observation. It is published only for the nation, states, and large areas, so it is kept separate from the complete county ranking above. The ten states with the highest 2024 annual share:
| State | Share rank | Seasonal-use homes | MOE (90%) | Share of all housing |
|---|---|---|---|---|
| Maine | 1 | 109,834 | ±3,823 | 14.4% |
| Vermont | 2 | 45,148 | ±2,203 | 13.2% |
| New Hampshire | 3 | 58,528 | ±4,358 | 8.9% |
| Alaska | 4 | 26,906 | ±1,824 | 8.2% |
| Delaware | 5 | 36,325 | ±2,816 | 7.6% |
| Florida | 6 | 741,429 | ±18,938 | 7.0% |
| Montana | 7 | 37,257 | ±2,814 | 6.9% |
| Hawaii | 8 | 36,624 | ±4,086 | 6.4% |
| Wisconsin | 9 | 162,570 | ±5,692 | 5.8% |
| Michigan | 10 | 234,649 | ±7,316 | 5.0% |
Counties with the highest vacation-home share
The complete, unfiltered ranking of all 3,144 counties and county equivalents puts Forest County, Pennsylvania first at 69.5%. Small resort and lake counties dominate this list because a modest number of cabins can be most of a small county's housing stock. The top 50 follow; the full 3,144-row file is in the downloads.
Counties with at least 10,000 housing units
Filtering to county equivalents with at least 10,000 housing units removes the smallest geographies and shows where large vacation-home markets concentrate. This is a separate comparison ranking, not a replacement for the complete ranking above.
| County | Rank (≥10k units) | Seasonal-use homes | Share of all housing | Total housing units |
|---|---|---|---|---|
| Valley County, Idaho | 1 | 8,044 | 62.5% | 12,878 |
| Lake County, Michigan | 2 | 7,515 | 55.8% | 13,461 |
| Nantucket County, Massachusetts | 3 | 6,925 | 55.0% | 12,594 |
| Dukes County, Massachusetts | 4 | 9,698 | 54.4% | 17,822 |
| Worcester County, Maryland | 5 | 29,929 | 52.6% | 56,867 |
| Camden County, Missouri | 6 | 20,943 | 52.3% | 40,072 |
| Vilas County, Wisconsin | 7 | 12,790 | 51.4% | 24,876 |
| Burnett County, Wisconsin | 8 | 7,889 | 51.2% | 15,396 |
| Grand County, Colorado | 9 | 8,717 | 50.0% | 17,421 |
| Cape May County, New Jersey | 10 | 49,655 | 49.9% | 99,599 |
| Mono County, California | 11 | 6,706 | 49.0% | 13,676 |
| Summit County, Colorado | 12 | 15,756 | 48.9% | 32,251 |
| Aitkin County, Minnesota | 13 | 6,773 | 47.5% | 14,253 |
| Roscommon County, Michigan | 14 | 10,865 | 46.8% | 23,213 |
| Cass County, Minnesota | 15 | 11,081 | 45.3% | 24,470 |
| Mackinac County, Michigan | 16 | 4,640 | 43.8% | 10,597 |
| Alcona County, Michigan | 17 | 4,514 | 43.7% | 10,320 |
| Avery County, North Carolina | 18 | 6,161 | 43.4% | 14,201 |
| Carroll County, New Hampshire | 19 | 17,026 | 42.1% | 40,421 |
| Sawyer County, Wisconsin | 20 | 6,785 | 41.8% | 16,250 |
| Clare County, Michigan | 21 | 9,015 | 41.0% | 22,008 |
| Bayfield County, Wisconsin | 22 | 5,216 | 39.1% | 13,356 |
| Oneida County, Wisconsin | 23 | 12,013 | 39.0% | 30,814 |
| Plumas County, California | 24 | 5,778 | 38.7% | 14,921 |
| Piscataquis County, Maine | 25 | 5,632 | 38.4% | 14,680 |
Counties with the most vacation homes
| County | Count rank | Seasonal-use homes | MOE (90%) | Share of all housing |
|---|---|---|---|---|
| Lee County, Florida | 1 | 79,437 | ±1,964 | 18.0% |
| Palm Beach County, Florida | 2 | 68,613 | ±1,972 | 9.5% |
| Broward County, Florida | 3 | 62,308 | ±1,961 | 7.2% |
| Collier County, Florida | 4 | 59,512 | ±1,624 | 24.9% |
| Maricopa County, Arizona | 5 | 58,731 | ±2,542 | 3.1% |
| Riverside County, California | 6 | 56,925 | ±1,710 | 6.5% |
| Barnstable County, Massachusetts | 7 | 55,061 | ±1,449 | 33.1% |
| Miami-Dade County, Florida | 8 | 50,471 | ±1,787 | 4.6% |
| Cape May County, New Jersey | 9 | 49,655 | ±880 | 49.9% |
| New York County, New York | 10 | 48,631 | ±3,044 | 5.3% |
| Pinellas County, Florida | 11 | 47,815 | ±1,926 | 9.2% |
| Suffolk County, New York | 12 | 44,136 | ±955 | 7.6% |
| Horry County, South Carolina | 13 | 40,967 | ±1,533 | 18.8% |
| Sarasota County, Florida | 14 | 40,327 | ±1,671 | 15.1% |
| Ocean County, New Jersey | 15 | 39,863 | ±1,119 | 13.5% |
| Sussex County, Delaware | 16 | 38,223 | ±1,040 | 25.2% |
| San Bernardino County, California | 17 | 37,152 | ±1,123 | 5.0% |
| Los Angeles County, California | 18 | 32,893 | ±1,749 | 0.9% |
| Worcester County, Maryland | 19 | 29,929 | ±547 | 52.6% |
| Polk County, Florida | 20 | 28,993 | ±1,323 | 8.5% |
| Manatee County, Florida | 21 | 27,330 | ±1,512 | 12.4% |
| San Diego County, California | 22 | 24,704 | ±1,312 | 2.0% |
| Clark County, Nevada | 23 | 23,906 | ±1,324 | 2.5% |
| Volusia County, Florida | 24 | 22,568 | ±1,162 | 8.0% |
| Brunswick County, North Carolina | 25 | 21,609 | ±816 | 21.8% |
Change since 2015-2019, by state
Comparing the non-overlapping 2015-2019 and 2020-2024 five-year periods, the national stock of seasonal-use homes changed by -697,228 units (-12.8%). Point-estimate changes describe the two periods; they do not establish causes.
| State | 2015-2019 homes | 2020-2024 homes | Change | Change % |
|---|---|---|---|---|
| Ohio | 57,989 | 60,446 | +2,457 | +4.2% |
| Delaware | 39,248 | 39,531 | +283 | +0.7% |
| Rhode Island | 17,478 | 17,575 | +97 | +0.6% |
| Iowa | 23,744 | 23,261 | -483 | -2.0% |
| New Jersey | 135,990 | 128,577 | -7,413 | -5.5% |
| Alabama | 77,054 | 71,964 | -5,090 | -6.6% |
| Idaho | 49,832 | 46,497 | -3,335 | -6.7% |
| California | 387,973 | 357,596 | -30,377 | -7.8% |
| North Carolina | 209,886 | 191,878 | -18,008 | -8.6% |
| Connecticut | 29,521 | 26,985 | -2,536 | -8.6% |
| State | 2015-2019 homes | 2020-2024 homes | Change | Change % |
|---|---|---|---|---|
| Mississippi | 41,446 | 28,153 | -13,293 | -32.1% |
| New Mexico | 51,457 | 36,548 | -14,909 | -29.0% |
| West Virginia | 42,164 | 29,965 | -12,199 | -28.9% |
| North Dakota | 15,600 | 11,225 | -4,375 | -28.0% |
| Texas | 247,358 | 192,713 | -54,645 | -22.1% |
| Oklahoma | 38,692 | 30,251 | -8,441 | -21.8% |
| Arizona | 210,150 | 165,168 | -44,982 | -21.4% |
| Nevada | 45,038 | 35,861 | -9,177 | -20.4% |
| Louisiana | 59,263 | 47,342 | -11,921 | -20.1% |
| District of Columbia | 3,428 | 2,747 | -681 | -19.9% |
All 44 Idaho counties
Idaho holds 46,497 seasonal-use homes — 5.8% of the state's housing stock. Valley County has Idaho's highest share at 62.5%. Fremont County ranks second in Idaho at 43.6% and 34th among 3,144 U.S. counties and county equivalents.
| County | Seasonal-use homes | MOE (90%) | Share of all housing | Share of vacant | National share rank |
|---|---|---|---|---|---|
| Valley County | 8,044 | ±443 | 62.5% | 94.0% | 6 |
| Fremont County | 3,844 | ±240 | 43.6% | 92.5% | 34 |
| Bear Lake County | 1,512 | ±153 | 37.6% | 86.8% | 52 |
| Boise County | 1,839 | ±233 | 32.3% | 87.7% | 91 |
| Blaine County | 4,795 | ±397 | 30.0% | 86.0% | 112 |
| Custer County | 911 | ±201 | 29.0% | 76.3% | 120 |
| Adams County | 760 | ±112 | 28.4% | 84.6% | 128 |
| Camas County | 178 | ±46 | 25.3% | 53.5% | 166 |
| Clark County | 107 | ±30 | 23.5% | 60.5% | 191 |
| Teton County | 1,428 | ±253 | 22.0% | 79.2% | 215 |
| Bonner County | 5,168 | ±448 | 19.2% | 78.5% | 261 |
| Lemhi County | 799 | ±156 | 17.1% | 65.6% | 314 |
| Idaho County | 1,195 | ±239 | 13.4% | 56.2% | 426 |
| Clearwater County | 537 | ±112 | 11.6% | 54.2% | 506 |
| Caribou County | 361 | ±126 | 11.4% | 52.9% | 522 |
| Benewah County | 470 | ±122 | 9.9% | 68.6% | 626 |
| Shoshone County | 578 | ±138 | 8.2% | 44.9% | 756 |
| Kootenai County | 6,004 | ±551 | 7.5% | 66.1% | 820 |
| Oneida County | 135 | ±82 | 6.4% | 75.0% | 924 |
| Owyhee County | 271 | ±111 | 5.6% | 51.1% | 1016 |
| Elmore County | 592 | ±120 | 4.8% | 49.2% | 1112 |
| Lewis County | 72 | ±24 | 3.9% | 28.6% | 1256 |
| Butte County | 50 | ±36 | 3.7% | 19.0% | 1309 |
| Boundary County | 182 | ±145 | 3.2% | 32.0% | 1423 |
| Washington County | 136 | ±62 | 2.9% | 31.9% | 1496 |
| Bonneville County | 1,193 | ±221 | 2.5% | 36.1% | 1622 |
| Madison County | 348 | ±174 | 2.3% | 19.1% | 1682 |
| Bingham County | 371 | ±156 | 2.1% | 26.6% | 1756 |
| Lincoln County | 39 | ±35 | 2.0% | 27.7% | 1817 |
| Bannock County | 701 | ±190 | 1.9% | 27.2% | 1834 |
| Nez Perce County | 351 | ±118 | 1.9% | 26.8% | 1849 |
| Power County | 53 | ±46 | 1.8% | 35.1% | 1898 |
| Gem County | 130 | ±113 | 1.6% | 41.8% | 1973 |
| Payette County | 161 | ±153 | 1.6% | 35.9% | 1996 |
| Latah County | 226 | ±102 | 1.3% | 17.1% | 2157 |
| Gooding County | 72 | ±54 | 1.2% | 16.4% | 2222 |
| Cassia County | 94 | ±53 | 1.0% | 15.6% | 2315 |
| Ada County | 1,918 | ±496 | 0.9% | 21.6% | 2420 |
| Twin Falls County | 273 | ±149 | 0.7% | 16.3% | 2533 |
| Canyon County | 461 | ±196 | 0.5% | 15.0% | 2742 |
| Jefferson County | 50 | ±45 | 0.5% | 8.6% | 2797 |
| Jerome County | 38 | ±58 | 0.4% | 7.1% | 2833 |
| Franklin County | 19 | ±32 | 0.4% | 6.8% | 2908 |
| Minidoka County | 31 | ±37 | 0.4% | 5.8% | 2917 |
Island Park and Fremont County, Idaho
Because this site serves Island Park-area owners, the dataset carries the local rows in full. In Island Park city, 80.7% of all housing units are seasonal-use homes in the 2020–2024 ACS 5-year estimates.
| Geography | Seasonal-use homes | MOE (90%) | Share of all housing | Share of vacant |
|---|---|---|---|---|
| United States | 4,743,227 | ±43,757 | 3.3% | 32.6% |
| Idaho | 46,497 | ±1,390 | 5.8% | 56.7% |
| Fremont County, Idaho | 3,844 | ±240 | 43.6% | 92.5% |
| Island Park city, Idaho | 426 | ±72 | 80.7% | 96.4% |
Occupancy, age, and home-value context
The occupancy split below comes from ACS Table B25002, whose vacant category is broader than the seasonal-use category above — it includes homes for sale, for rent, and other vacancies. The two measures are labeled separately for that reason.
| Geography | Total housing units | Occupied | Vacant (all reasons) | Vacant share | Median age | Median home value |
|---|---|---|---|---|---|---|
| United States | 143,775,355 | 129,227,496 | 14,547,859 | 10.1% | 38.9 | $332,700 |
| Idaho | 795,014 | 713,005 | 82,009 | 10.3% | 37.3 | $418,600 |
| Fremont County, Idaho | 8,810 | 4,654 | 4,156 | 47.2% | 40.0 | $314,200 |
| Island Park CCD, Fremont County, Idaho | 4,121 | 546 | 3,575 | 86.8% | 62.3 | $494,000 |
| Island Park city, Idaho | 528 | 86 | 442 | 83.7% | 67.1 | $293,800 |
Definitions: what counts as a vacation home
The core measurable category is the U.S. Census Bureau vacancy status “for seasonal, recreational, or occasional use” in ACS Detailed Table B25004: estimate variable B25004_006E, with its published 90% margin of error B25004_006M. These are housing units that are not any household's usual residence — weekend cabins, summer and winter homes, and other occasionally used dwellings.
Two denominators appear throughout this page: the total-housing denominator is Table B25001 (B25001_001E) and the total-vacant denominator is Table B25004 (B25004_001E). The vacancy-status category is a housing-stock measure — it is not a count of active short-term-rental listings, and it does not distinguish rented vacation homes from purely private ones.
Methodology and source files
Every published row was read directly from a cited primary Census file or calculated directly from verified rows; no provisional rows are included. The complete state-and-county ranking uses the 2020-2024 ACS 5-year estimates because that product covers every geography. The separate 2024 ACS 1-year file is an annual nation-and-state supplement and is never merged into the county ranking.
Official core input files
- 2020-2024 ACS 5-year: B25001, B25004, geography labels
- 2024 ACS 1-year: B25001, B25004, geography labels
- 2015-2019 ACS 5-year comparison: B25001, B25004, geography labels
- Island Park context supplement: B25002 occupancy, B01002 median age, B25077 median home value
Core processing steps
- Read B25001 and B25004 table-based Summary File records.
- Retain standard geography component 00.
- Join the detailed tables and geography labels on GEO_ID.
- Retain nation, state, county/county-equivalent, and Island Park place rows.
- Exclude Puerto Rico from the stated 50-state-plus-D.C. ranking universe.
- Calculate B25004_006E ÷ B25001_001E × 100 for share of all housing.
- Calculate B25004_006E ÷ B25004_001E × 100 for share of vacant housing.
- Retain the Census-published count margin of error unchanged.
- Rank on unrounded values, using minimum rank for ties.
- Publish the complete unfiltered county share rank and a separate comparison rank for county equivalents with at least 10,000 housing units.
- Join non-overlapping 2015-2019 nation-and-state estimates.
- Build the 2024 annual nation-and-state product separately.
- Validate row counts, national totals, local spot checks, ratio bounds, ranks, and required metadata.
Precision and uncertainty
- Rankings use unrounded values; displayed shares are rounded only after ranking.
- ACS figures are survey estimates, not administrative counts.
- Published ACS count margins of error use a 90% confidence level.
- The dataset does not publish derived ratio margins of error; a covariance-aware method such as the Census Variance Replicate Estimate Tables is required for that calculation.
- The relative-MOE column in the downloads is the count MOE divided by the count estimate; it is not an interval for a calculated share.
Reproduction
Download the official raw files listed above, run build_vacation_home_dataset.py and then build_island_park_context.py, and compare checksums against vacation-home-statistics-sha256.txt. Both scripts honor the optional VACATION_HOME_DATA_DIR environment variable; otherwise they read and write in their own directory.
Limitations
- The 2020-2024 estimate summarizes responses collected over five years.
- The 2024 1-year and 2020-2024 5-year products are not consecutive annual observations.
- The vacancy-status category is not an active short-term-rental listing count.
- County-equivalent definitions can change; historical county comparison requires matched geography.
- Point-estimate changes do not establish causes.
- Census errata can require a rebuild of the dataset.
Download the dataset
Every file is served directly from this site, with SHA-256 checksums and the exact build scripts for full reproduction. The figures on this page are rendered from these same files.
| File | Contents | Coverage |
|---|---|---|
| vacation-home-statistics-2020-2024-acs-states.csv | All 50 states and D.C. — 2020-2024 ACS 5-year, with 2015-2019 comparison | 51 data rows |
| vacation-home-statistics-2024-acs-1-year-national-states.csv | Nation and states — 2024 ACS 1-year annual supplement | 52 data rows |
| vacation-home-statistics-2020-2024-acs-counties.csv | All 3,144 counties and county equivalents — 2020-2024 ACS 5-year | 3,144 data rows |
| vacation-home-statistics-2020-2024-acs-idaho-counties.csv | All 44 Idaho counties — 2020-2024 ACS 5-year | 44 data rows |
| vacation-home-statistics-2020-2024-acs-local.csv | United States, Idaho, Fremont County, and Island Park city core rows | 4 data rows |
| vacation-home-statistics-2020-2024-acs-island-park-context.csv | Island Park occupancy, age, and home-value context (B25002, B01002, B25077) | 5 data rows |
| vacation-home-statistics-2020-2024-acs.json | Full dataset as JSON with metadata | All records |
| vacation-home-statistics-methodology.md | Dataset methodology (Markdown) | Documentation |
| vacation-home-statistics-sha256.txt | SHA-256 checksums for every file | Checksums |
| build_vacation_home_dataset.py | Reproduction script — core dataset | Python source |
| build_island_park_context.py | Reproduction script — Island Park context supplement | Python source |
| vacation-home-statistics-state-county-dataset.zip | Everything above in one archive | ZIP archive |
Frequently asked questions
- How many vacation homes are there in the United States?
- The 2024 American Community Survey 1-year estimates count 4,342,127 housing units held for seasonal, recreational, or occasional use in the United States — 3.0% of all 146,740,964 housing units and 31.0% of all vacant units. The Census Bureau counts these homes in the vacancy universe because they are not anyone's primary residence.
- Which state has the most vacation homes?
- Florida has the most seasonal, recreational, or occasional-use homes of any state in the 2020-2024 ACS 5-year estimates. Ranked by share of all housing instead of raw count, Maine ranks first.
- What officially counts as a vacation home in this data?
- This page uses the U.S. Census Bureau vacancy category “for seasonal, recreational, or occasional use” from ACS Detailed Table B25004 (variable B25004_006E). It covers homes held for weekend, summer, winter, or other occasional stays that are not a household's usual residence. It is a housing-stock measure, not a count of active short-term-rental listings.
- Why do the 1-year and 5-year numbers differ?
- The 2024 ACS 1-year estimates summarize a single year of survey responses and are published only for the nation and states. The 2020-2024 ACS 5-year estimates pool five years of responses, which makes reliable county-level figures possible. The two products measure overlapping but different periods, so their point estimates differ and are never mixed in one ranking on this page.
- Can I reuse this data?
- Yes. The underlying figures are U.S. Census Bureau public data; the compiled CSVs, JSON, checksums, and build scripts on this page are free to download, verify, and reuse. The citation format below identifies this page as the compilation source.
How to cite this page
Island Park Property Management Research. “Vacation Home Statistics by State and County: Latest U.S. Census Data.” https://islandparkpropertymanagement.com/research/vacation-home-statistics-by-state-county/. Data verified July 29, 2026; page last updated July 30, 2026. Underlying data: U.S. Census Bureau, 2024 ACS 1-Year and 2020-2024 ACS 5-Year Estimates, Detailed Tables B25001 and B25004.
Deep links: every section, table, and key figure on this page has a stable id anchor — for example #stat-us-total or #table-counties-by-share. Corrections go through the process described on editorial and source standards; context on the publisher is on about this site. More owner reference material is on the resources page.